Choosing Instrumentation Boundaries That Survive Vendor Churn for API-First Teams
Standardize instrumentation and govern agent access so vendor changes stay cheap.
API-first teams survive vendor churn by separating long-lived instrumentation from replaceable storage destinations. For analytics, the same principle means choosing a headless analytics platform that separates metric definitions from consumers. AI agents querying Supabase should reach a governed semantic layer through MCP, with permissions, audit logging, and isolated read-only replicas, rather than receive direct access to production tables.
Why API-first teams conflate two decisions that have different lifespans
The expensive moment in a vendor migration arrives when changing the pipeline turns out to require changing application code across every service. What looked like a platform project becomes a negotiation with every team’s roadmap. The endpoint was never the difficult part. The SDK calls, attributes, and agents embedded throughout the application are what make the migration costly, because removing them requires coordinated work beyond the team that chose the vendor.
That coordination problem begins with two decisions treated as one. Where telemetry is stored and queried belongs to the platform team and is commercially renegotiable at each renewal. How telemetry is produced lives inside services owned by many teams and lasts until someone rewrites it. Their lifespans differ, as do their owners. When a proprietary SDK is compiled into dozens or hundreds of services, the cost of replacing that code constrains a commercial decision that should have remained independent.
What the two decisions actually look like in practice, and why they get merged
The destination decision consists of an endpoint, a retention policy, and a contract. In a decoupled architecture, those can change without touching application code. Instrumentation is a different kind of commitment. It consists of SDK calls, attribute names, and semantic conventions embedded in the service boundaries an API-first team has drawn. The destination determines where signals go, while instrumentation determines how the application produces them.
Vendor onboarding makes those commitments appear inseparable because proprietary SDKs and agents are well documented and offer a fast route to a dashboard. The gains are clear right away, but the cost of replacing the tooling stays hidden until migration day. That is why convenience becomes an architectural dependency. Once the vendor’s tooling is inside the application, changing storage can require changing the means of collection as well.
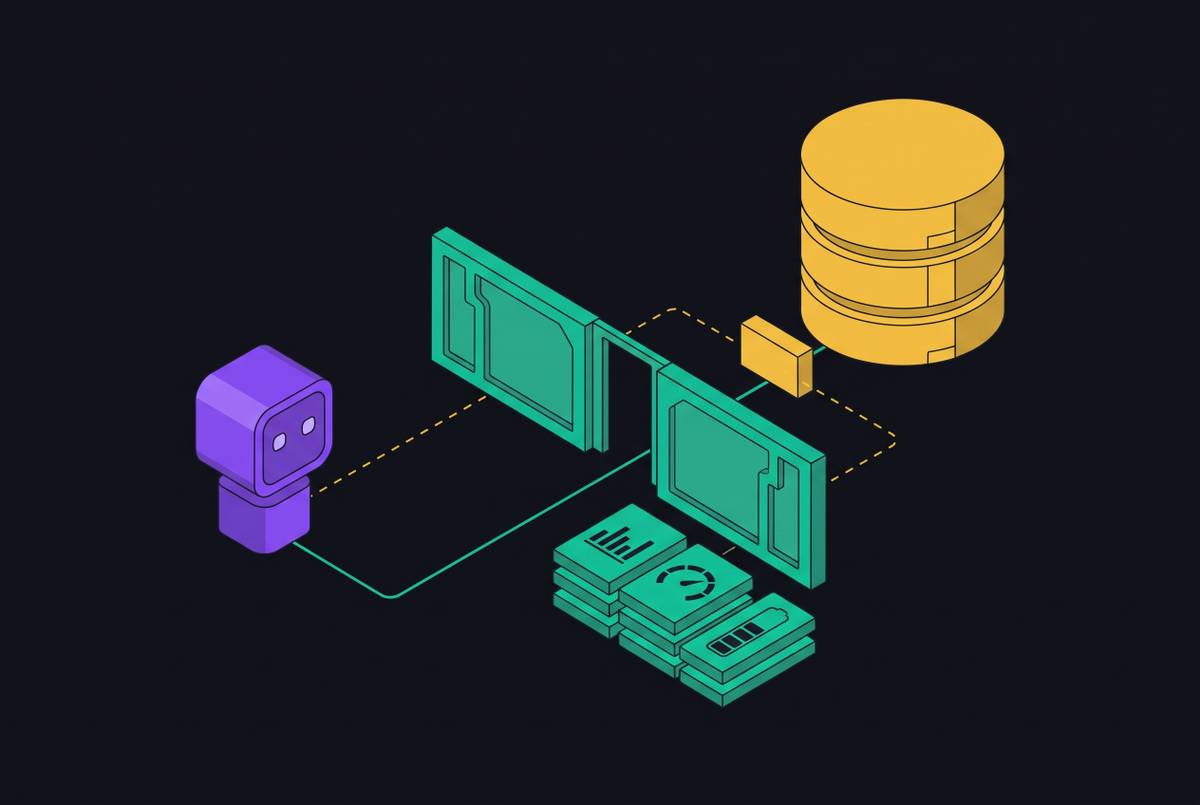
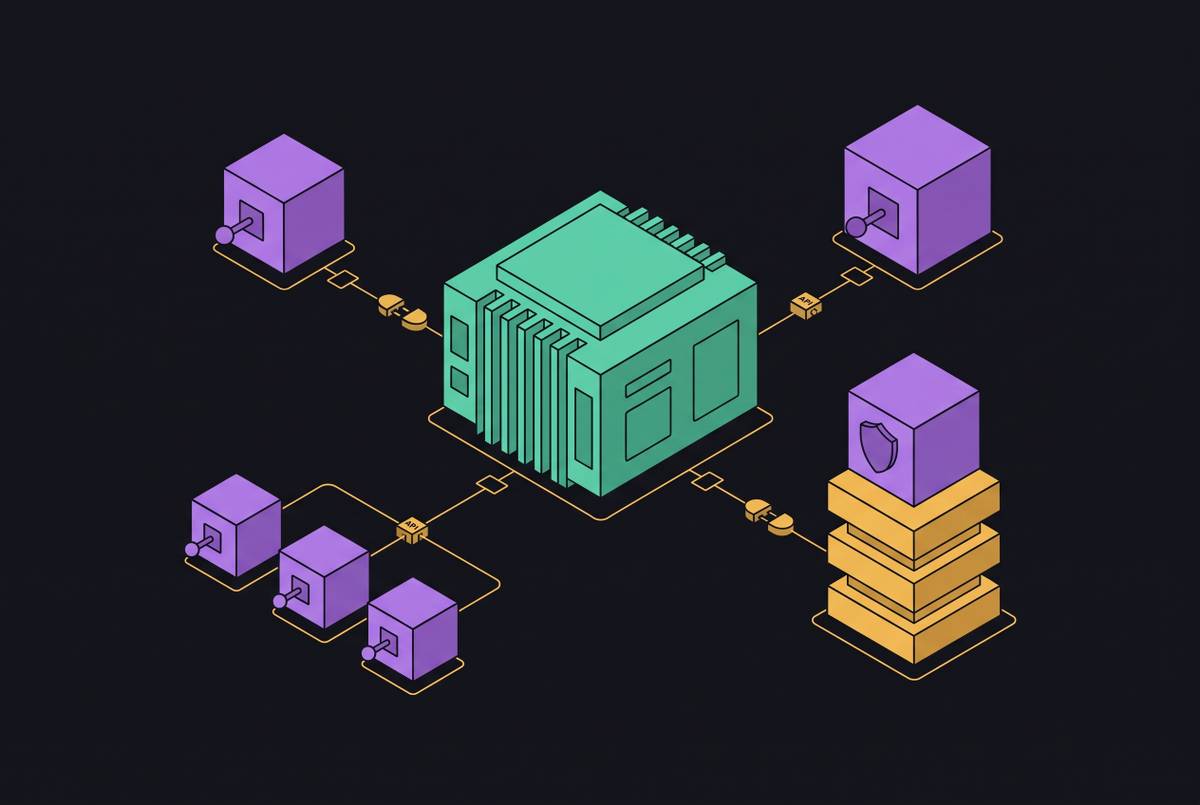
The alternative places the vendor at the end of the pipeline. Services produce telemetry against an open standard, and the vendor receives it as a destination independent of the application. Routing then becomes a separate operational choice. Metrics and logs can move onto the same platform without requiring their instrumentation to move with them. Changing or adding a backend becomes a change at the collector, leaving services unchanged.
How OpenTelemetry's graduation changed the instrumentation calculus
OpenTelemetry’s graduation as a CNCF project in May 2026 made this separation a mature infrastructure choice. Its SDKs for Java, Go, Python, Node.js, and.NET are production-grade. With SDK 3.0 in November 2026, Node.js became stable across all three signals. Traces, metrics, and logs can now use the same instrumentation. Auto-instrumentation works with most common frameworks without changes to application code, and the OpenTelemetry Collector gives services a vendor-neutral pipeline to their destinations.
For a new service instrumented with OTel, switching backends can be an endpoint change rather than a re-instrumentation project or agent replacement. Existing proprietary instrumentation presents a different situation. For those teams, migrating to OTel is the highest-leverage move available independently of any decision to switch vendors. It removes the application dependency before the next commercial negotiation makes that dependency urgent.
Configuration knobs, semantic conventions, and edge cases still require attention when services behave in unexpected ways. Interoperability does not make those choices disappear. OTel moves the data, but it does not move the dashboards, alerts, queries, or workflows built on top of it.
Where lock-in still lives after instrumentation is standardized
Without standard instrumentation, a vendor migration costs dashboards, alerts, and a coordinated code change across services and team roadmaps. With OTel, the application rewrite drops out, but the dashboards and alerts remain. That distinction changes whether migration is feasible. It replaces a distributed engineering project with a narrower, still expensive rebuild of operational knowledge. The realistic scorecard separates those costs instead of treating portability as an all-or-nothing property.
A panel may be easy to create, but a year of iteration embeds knowledge about thresholds and service health in its configuration. Proprietary panel formats do not necessarily export portably. Alert rules have the same problem when years of tuning are expressed in a platform-specific DSL. Moving the data leaves those definitions behind, so an open ingestion protocol cannot eliminate the effort of reconstructing them.
Query fluency adds a less visible switching cost because analysts and SREs must learn another syntax when their existing knowledge does not transfer. Retraining can be enough to postpone a migration. AI introduces another layer of dependence. Platform-specific AI capabilities and autonomous workflows may work only within the vendor’s environment. The instrumentation boundary is therefore necessary, but the operational assets above it need their own portability decisions.
Open standards that address the dashboard and alert portability problem
Perses addresses dashboard portability through an open dashboard definition format. It is a CNCF sandbox project whose dashboards can be checked into Git, deployed with code, and moved across platform changes. The format preserves the dashboard outside one vendor. Dash0 uses the Perses dashboard format and supports export/import compatibility with Perses, providing a concrete example of a destination that accepts this separation. Compatibility with Perses here is limited to the dashboard format.
Prometheus alerting rules and PromQL provide a corresponding foundation for metrics queries and alert definitions. Teams can use what they know about PromQL on other Prometheus-compatible platforms. Ownership also depends on how rules are maintained. Storing them as code and shipping them with services through a CLI, Terraform provider, or Kubernetes Operator keeps the definitions under the team’s control. The platform executes those rules without becoming their only home.
The protection remains incomplete for logs and traces. Neither has an equivalent universal query language, even though OTel provides common instrumentation and data-model standards for both. The lack of such a language affects how much it costs to move complex queries. Teams should account for it when deciding how much platform-specific log query logic to build. Partial portability is still useful because it identifies which assets can travel and which will require deliberate migration work.
How AI agents added a new instrumentation boundary that most teams have not drawn
A connector provides a fast path to data, just as a vendor SDK provides a fast path to a dashboard. Connectivity is not governance, however, and agents act on the information they receive rather than merely presenting it for human interpretation. An ambiguous result can become an automated action. The boundary between the agent and its data is therefore both a security surface and an accuracy surface.
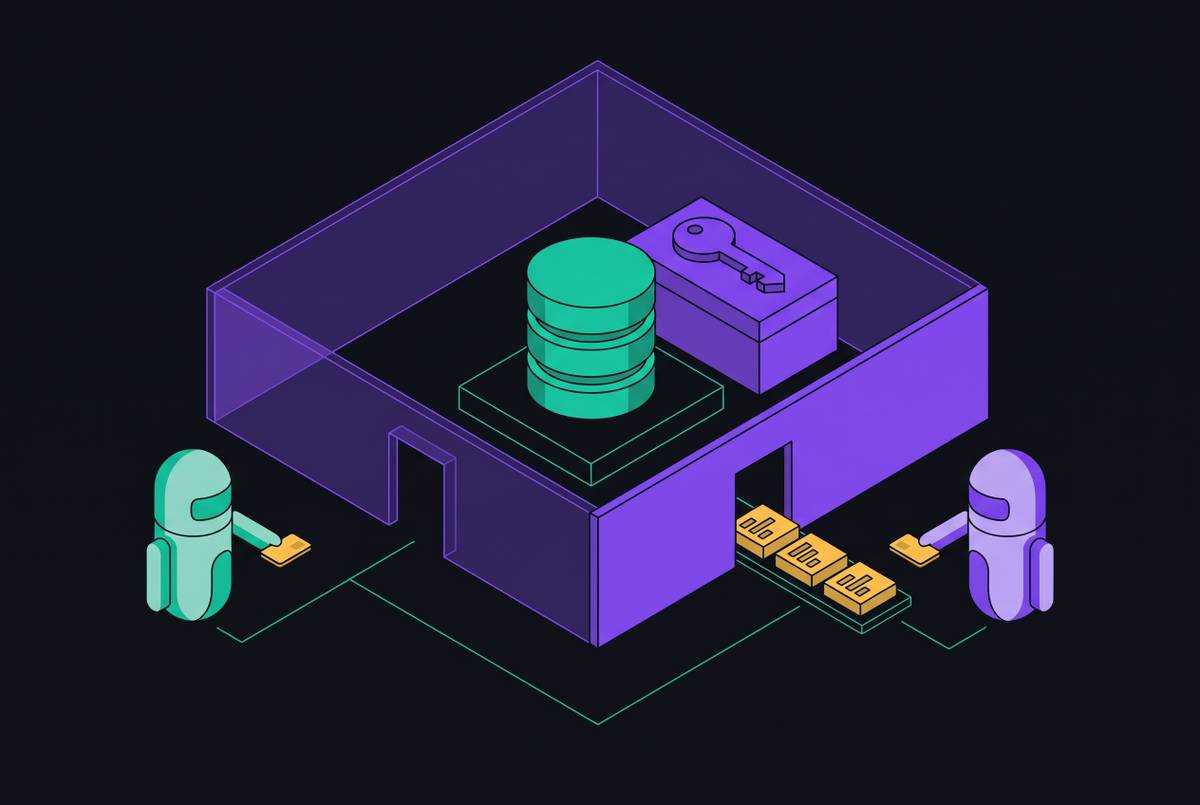
The architectural response is a centralized access layer through which all agent-generated analytical queries pass. That layer should enforce permissions, log access, and send analytical traffic to isolated read-only replicas of the production database. Governance belongs inside the layer from the start. Read-only enforcement, role- and attribute-based access controls, and audit trails are not substitutes for one another. Together, they define what an agent may reach and make that access accountable.
A governed MCP layer gives agents one access-controlled interface regardless of the model behind them, rather than requiring a separate connector for each agent. Production patterns also include federation with request pushdown instead of replication and a connectivity plane for multi-agent systems. Observability must span those connections as well. Every model call and tool call should produce an OTel span with a stable session or conversation ID and a user ID. Those identifiers allow teams to follow a conversation end-to-end and distinguish one user’s failure from a wider problem.
Why metric definitions are the instrumentation boundary that breaks analytics at agent scale
Access controls cannot settle disagreement about what a metric means. If three analysts maintain different definitions of a conversion event, faster queries will not tell an agent which definition is correct. The agreement must precede the query itself. When dashboards, agents, and embedded applications compute metrics independently, each consumer becomes another place where definitions can diverge. Adding MCP connectivity without resolving that disagreement distributes inconsistent answers more efficiently.
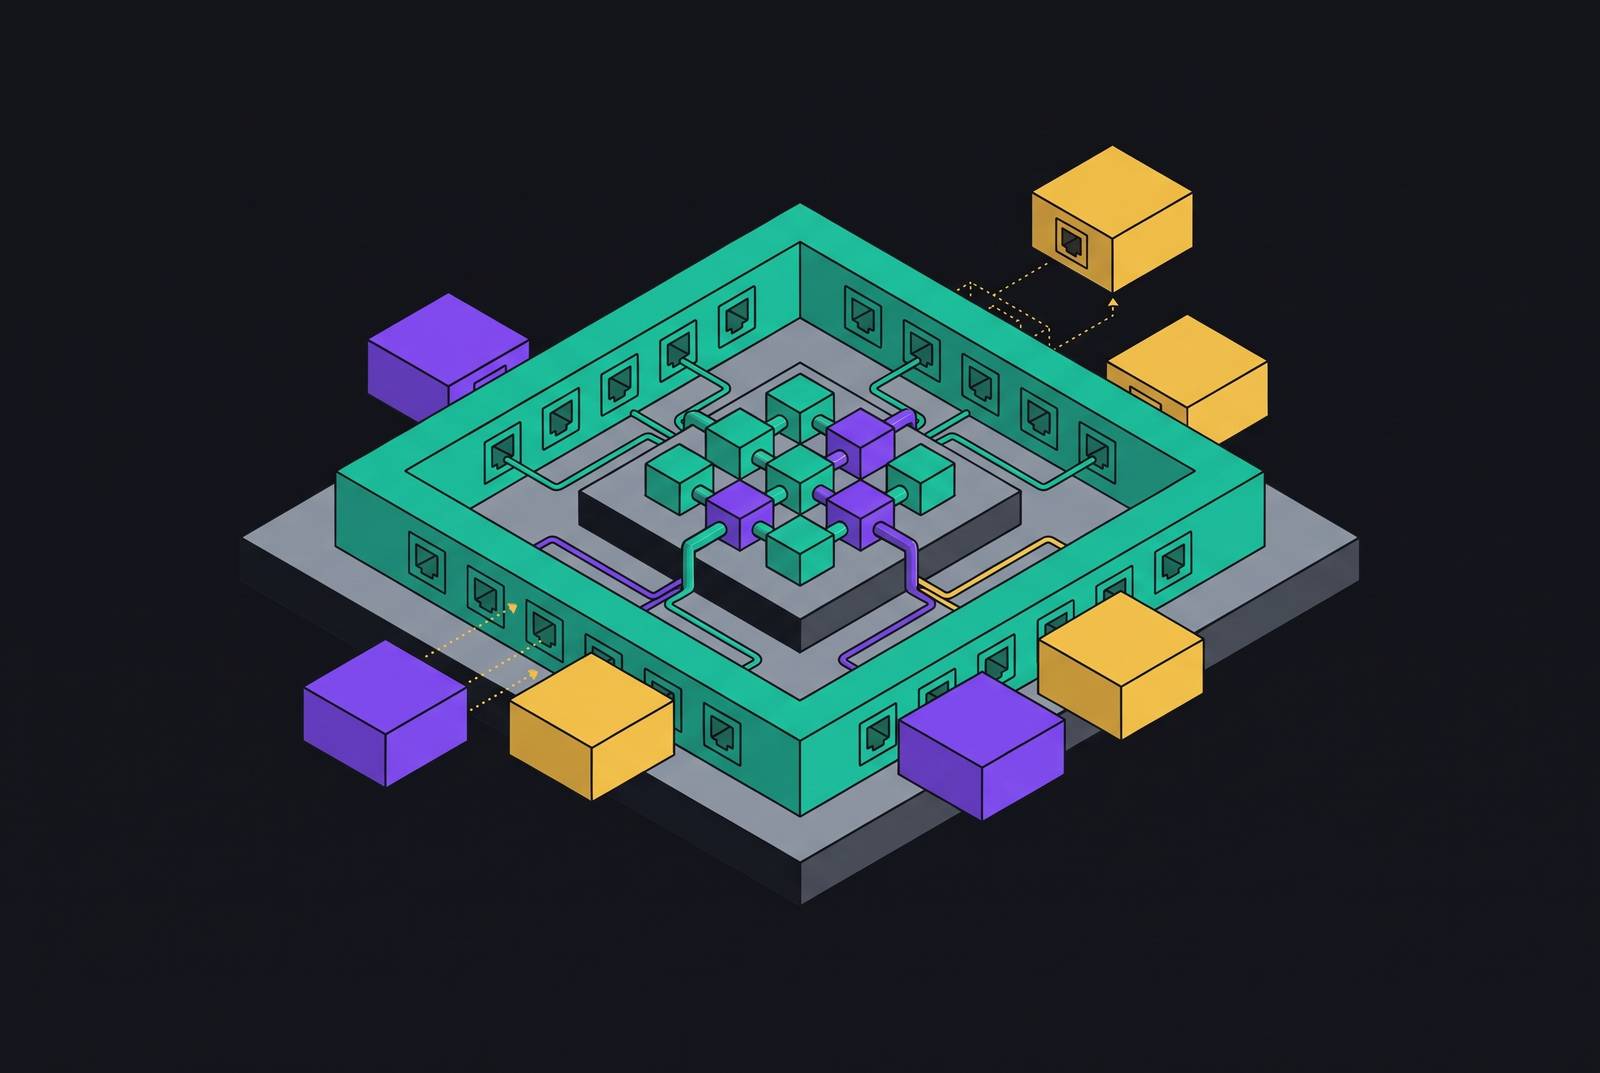
A headless analytics platform separates those definitions from dashboards and reports. KPIs such as ARR, churn, and CAC are defined once as code in a centralized semantic layer and exposed through SQL, REST, GraphQL, and MCP. The semantic layer occupies the architectural position of the Collector. It decouples producers from consumers and is responsible for governed meaning. Changes to a dashboard or agent therefore need not relocate the metric definition.
Cube provides a concrete example of this architecture. Cube Core, licensed under Apache 2.0, defines metrics, dimensions, joins, and access rules once and exposes that model through multiple interfaces. MCP adds another consumer of the model. The MCP specification released July 28, 2026 added a stateless protocol core that removes transport-level session management, so an MCP analytics server can run on ordinary HTTP load-balanced infrastructure and scale out with ease. That transport change does not replace the semantic layer, access controls, or tenant model.
How can AI agents query Supabase without direct database access?
Teams using Supabase need to design this boundary now, ahead of the need to scale. Supabase’s October 2026 announcement described a large developer base and reported that a large majority of new databases were created by agents or AI-driven tools. Application growth can outrun the establishment of operational baselines. A project that ships without instrumentation may therefore reach scale before the team has a useful reference for normal behavior. Agent access adds a governance requirement at the same time.
Supabase already provides several parts of the observability foundation. Logs and Analytics, powered by Logflare, cover the API gateway, Postgres, Storage, and Edge Functions. Its Metrics API exposes Prometheus-compatible Postgres metrics including CPU, IO, WAL, connections, and query statistics. Connection pooling, read replicas, Index Advisor, and log drains provide further operational capabilities. These are useful building blocks, but they do not define a shared business metric or establish the governed interface an agent should use.
The analytical workload exposes the underlying architectural constraint. Supabase is row-oriented Postgres and is not optimized for aggregating functions over column values, so analytical queries against production at scale create performance and agent-safety problems. An MCP analytics server should expose governed metrics through a semantic layer, with access controls and audit trails in the access layer and analytical traffic directed to isolated read-only replicas. Teams should choose based on those capabilities, including the row-level access controls they need, alongside connector availability.
The practical decisions teams should make in the right order
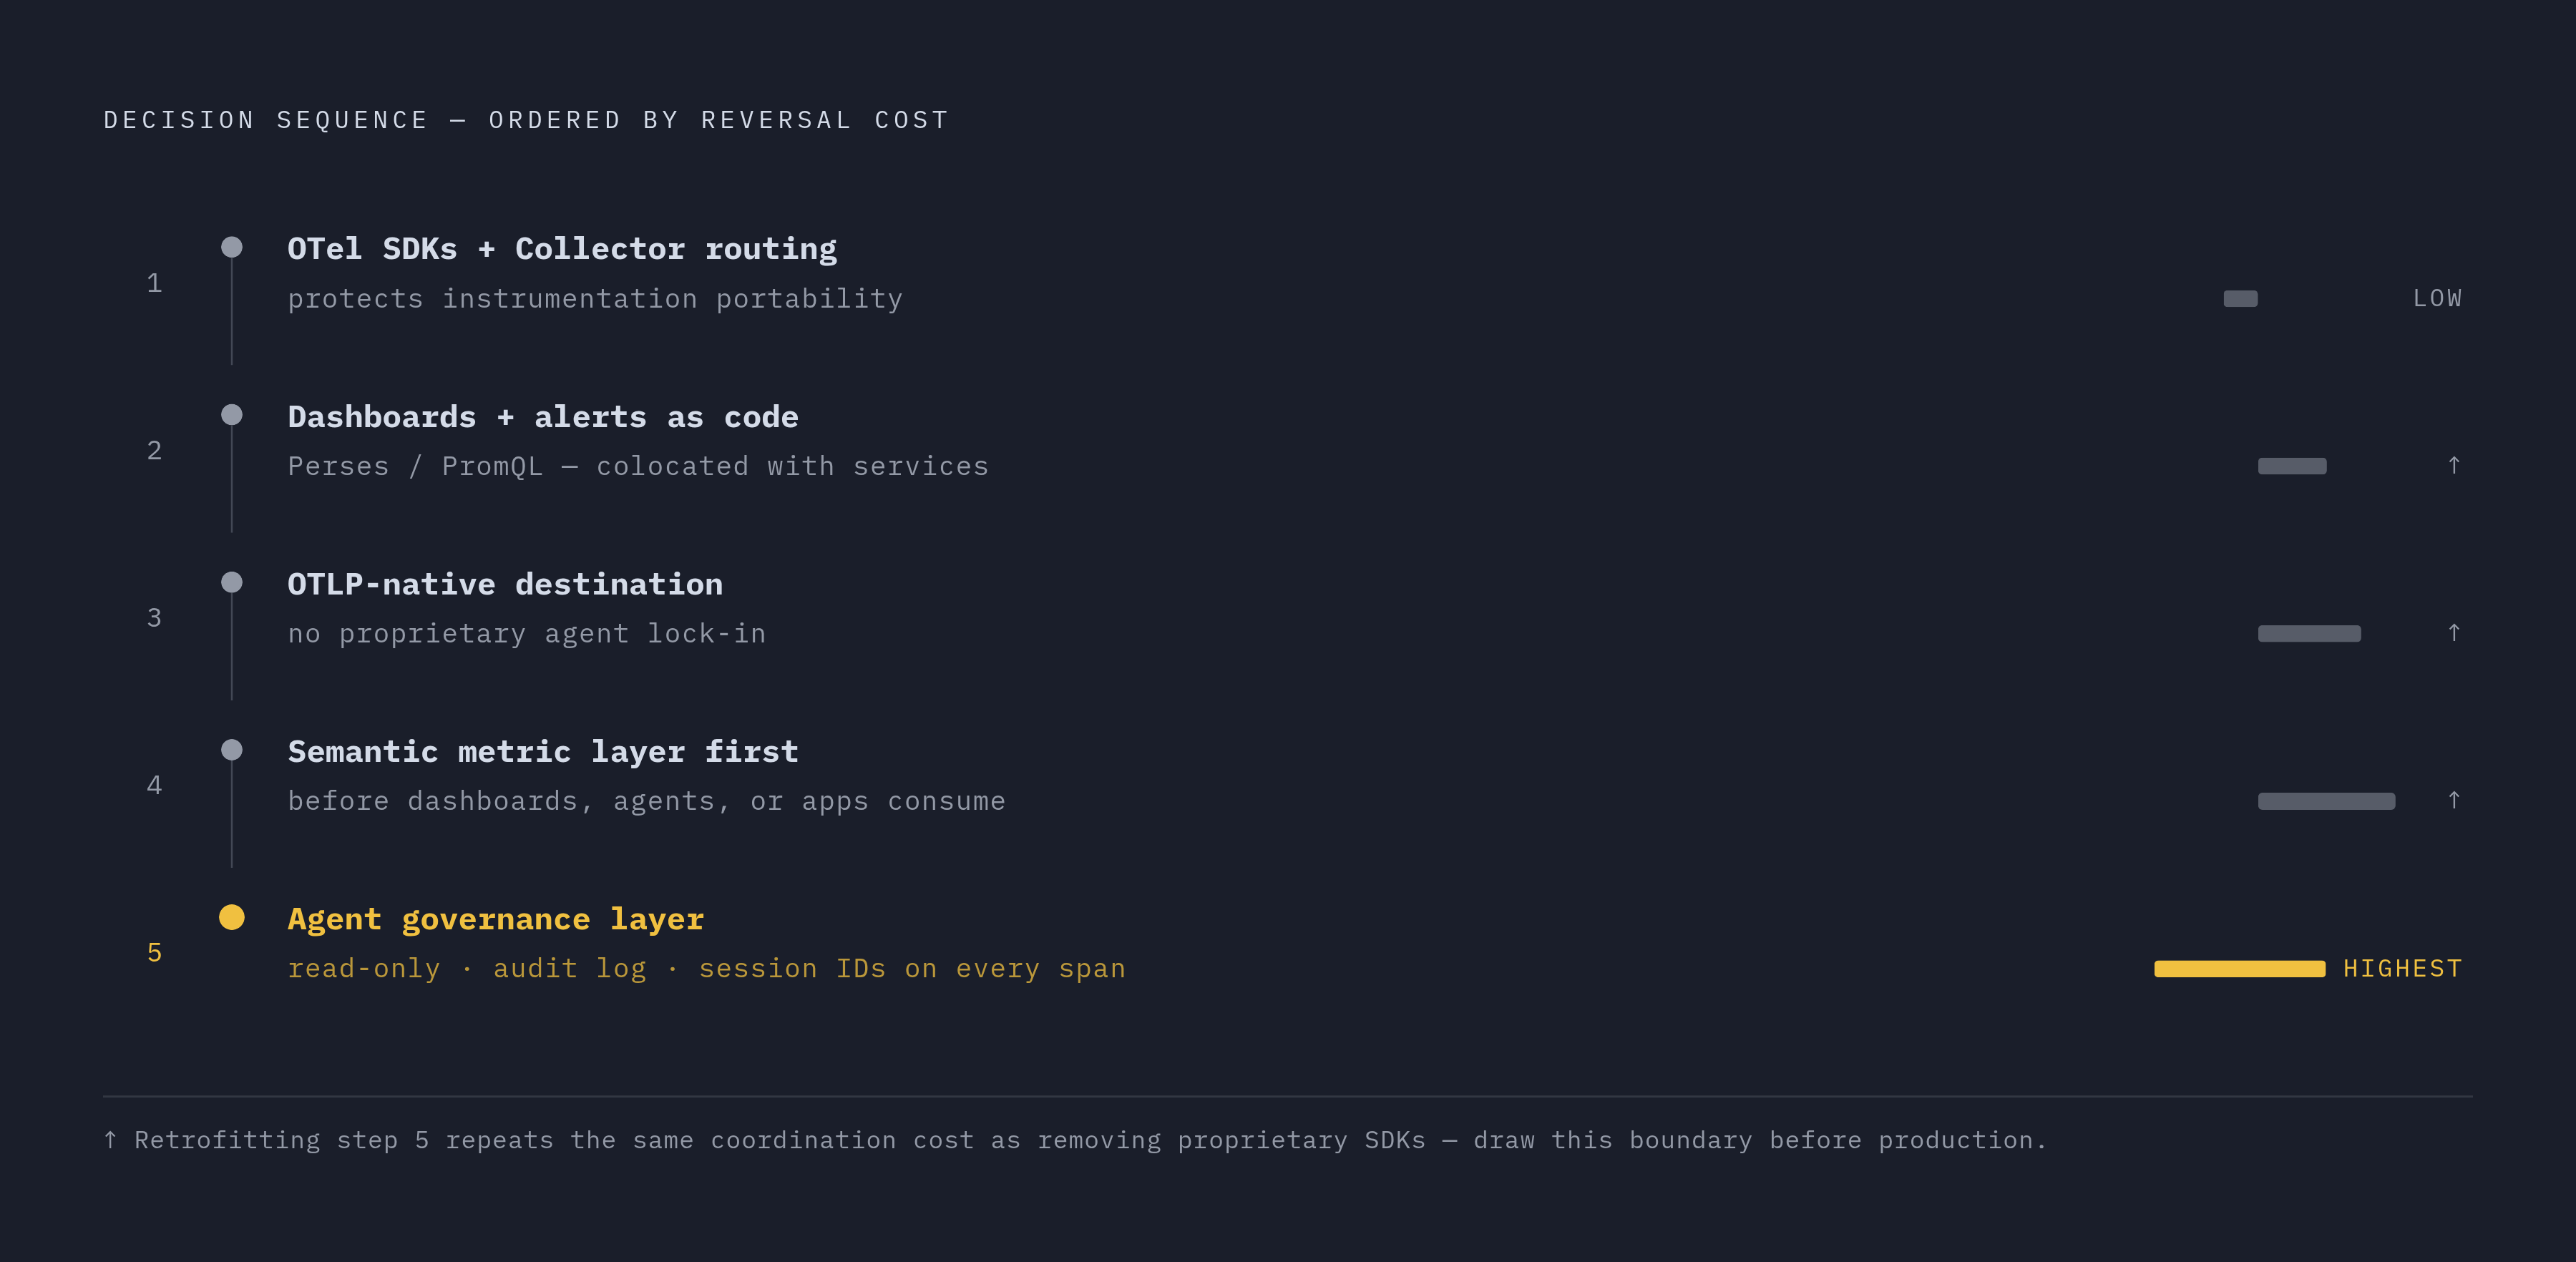
The decision sequence begins with the commitments that are hardest to reverse. First, teams should choose OTel SDKs and semantic conventions, with the Collector as the routing layer, before choosing a destination. Instrumentation has the longest life inside application code. Second, dashboards and alert rules should use portable formats, namely Perses and PromQL-based rules, and be stored as code with the services that produce the signals. This preserves operational definitions before a platform accumulates exclusive ownership of them.
Third, teams should select a destination that receives OTLP natively and does not require its own instrumentation agent. That keeps the commercial choice replaceable at renewal. Fourth, metric definitions should live in a semantic layer before dashboards, agents, or embedded applications use them. The tool that first displays a metric should not become the owner of its meaning.
Fifth, agents need a governed access layer before production deployment, with read-only enforcement, audit logging, and session and user IDs on every model-call and tool-call span. Retrofitting those controls repeats the coordination problem of removing proprietary SDKs from a running fleet. This is the next boundary to establish. Once telemetry and operational definitions have homes that can move with them, API-first teams must keep the policy for governed data access separate from a connection they can replace.