MCP Servers as the Analytics API for AI Agents
Agents need governed metrics, not raw database access, to return trustworthy answers.
MCP servers are becoming the analytics API for AI agents, but trustworthy answers depend on the governed metrics they expose. For API-first and agent-first teams, a headless analytics backend should serve pre-modeled datasets without requiring a dashboard UI. On Supabase, that means separating agent queries from production and giving agents, dashboards, and reports the same approved calculations.
What MCP servers actually do when an AI agent asks for a number
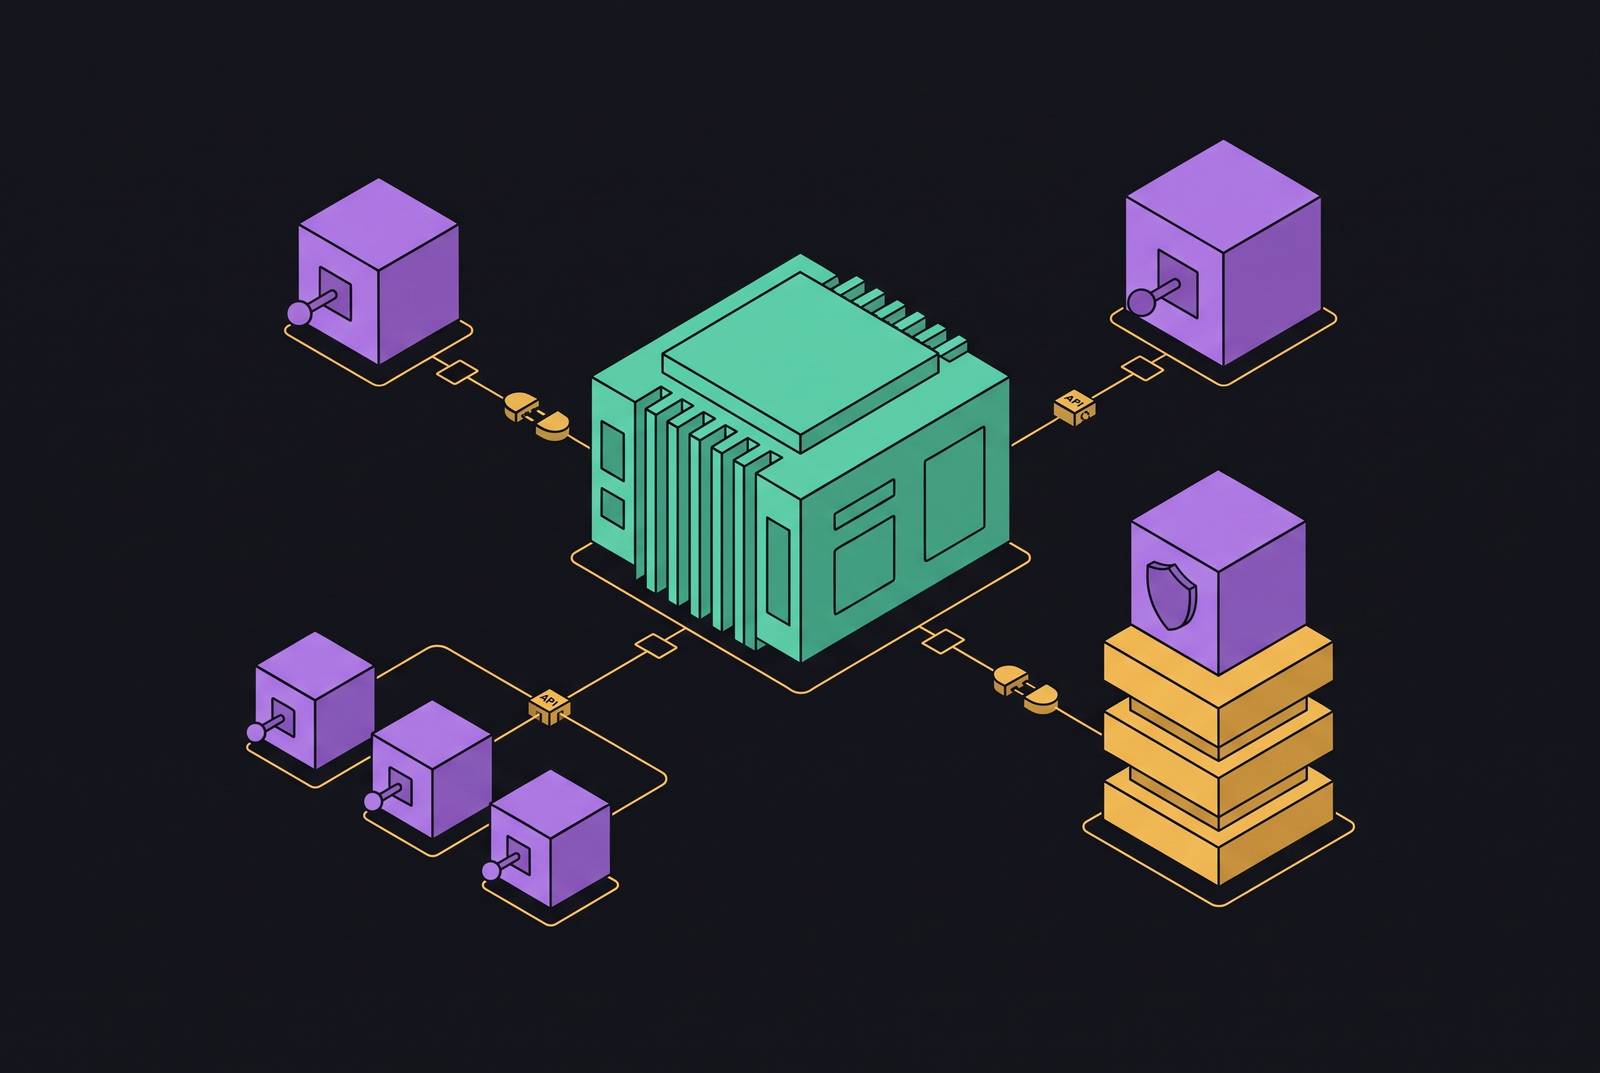
Anthropic introduced Model Context Protocol in November 2024 to replace connections built just for each pair of AI client and data source. An MCP interaction has three roles, namely the host application, its embedded MCP client, and the MCP server. The host may be Claude Desktop, Cursor, or a custom agent. The server translates the agent’s tool call into an API request or SQL query and returns a structured result.
This lets an agent answer a question about live data rather than work only with information preloaded into its context. The server handles authentication, rate limiting, schema mapping, and error handling, so the agent need not know which underlying endpoint to call. Unlike a scheduled data transfer, the interaction starts with a question and retrieves the information needed to answer it.
By early 2026, the public MCP server count exceeded 10,000, with support across Claude, ChatGPT, VS Code, and Cursor. MCP was donated to the Linux Foundation’s Agentic AI Foundation in December 2025. That combination of adoption and shared stewardship makes MCP an infrastructure-grade interface shared across assistants.
Why the protocol reaching production scale forces a governance problem into the open
A common interface standardizes access, but it does not standardize what the returned data means. As more agents use that interface, they run into naming gaps, permission gaps, and metric definitions that disagree at a faster pace. A human analyst may stop at an ambiguous definition and ask a colleague. An agent can instead select a plausible interpretation and return a number with no visible sign of uncertainty. The connection works while the answer fails.
The strongest objection is that capable agents can resolve such ambiguity themselves. They may, but resolving it during each query leaves the business definition to an ad hoc decision. Two agents can interpret the same question differently, and one agent can change its interpretation as its model or prompt changes. Faster retrieval then produces inconsistent answers faster. Governance is more urgent because MCP makes it easier to ask questions.
What happens when agents query production databases directly
Direct database access is the shortest route from an agent to an answer, but it combines three distinct risks. The first is security, because production credentials embedded in an agent’s configuration give it access that should remain behind a controlled gateway. The second is performance, because aggregations, large joins, and historical calculations can saturate connection pools and slow production requests. The third is accuracy, because transactional tables do not encode a complete, approved business interpretation. A raw query may double-count events, mishandle soft-deleted records, or omit currency conversion.
Supabase makes the distinction tangible. Its MCP tools include execute_sql, apply_migration, get_logs, and project management, which are useful capabilities with a broad reach when left unscoped. Least privilege means using database users set up for specific tasks, sending analytical work to read replicas, and treating each action as something that may need an audit. A centralized gateway should hold credentials, enforce permissions, and log each access attempt.
Session-level authorization alone is not enough. Each tool call must be checked against what the request asks for, what has already happened in the session, and the business context at the time. Static roles establish a boundary, but they cannot account for every combination of actions an agent might attempt.
The reference architecture that separates agent access from source systems
A sound reference architecture has four layers, beginning with agent consumers at the top. Beneath them, a policy and governance layer enforces role-based access control, rate limits, audit logging, and data loss prevention. An MCP server mesh turns calls that have been allowed into requests to systems of record. Source systems sit at the base, beyond the agent’s direct reach.
At runtime, the governance layer intercepts the tool call and evaluates it before routing it to the appropriate MCP server. The server translates the approved analytics request into a read-only query. The result returns through the stack with an audit trail. Standardized tool access and governance do different jobs, even when both are available through one endpoint.
Attribute-based controls make that boundary more precise. Row-level security limits which records an agent can retrieve, while column-level masking redacts sensitive fields within permitted results. A fraud detection agent, for example, can see the amounts of transactions without seeing payment card numbers. Analytical connections are usually read-only, while operational writes need further approval. A sandboxed trial against a shadow copy can return a predicted diff for human review before the real write executes.
Why pre-modeled metrics are the prerequisite, not an optimization
Isolation protects production, but a replica does not tell an agent what revenue means. The agent still needs rules for which rows count, how refunds are handled, and which time zone applies. Those rules cannot be reliably inferred from column names. A pre-modeled metric records a calculation defined by people who understand the business, then makes that calculation available to every consumer. The proper unit of agent analytics is therefore a modeled, pre-calculated dataset.
SQL skill does not remove this requirement. A syntactically correct query can apply the wrong business rule, and a plausible answer does not establish a connection to an approved definition. Pre-calculation moves that decision out of the conversation and into a shared data layer. Dashboards and agents then retrieve the same pre-calculated metric. This is the prerequisite for trustworthy MCP analytics.
Salesforce’s Headless Data 360 for MCP launched in developer preview in May 2026 and expanded August 19, 2026, combining natural-language querying with semantic models, transforms, and formulas. ZoomInfo’s GTM.AI became generally available on June 1, 2026, as a headless GTM context layer exposing verified intelligence through MCP. These products serve different needs, but both place a data layer between the agent and the answer.
How Supabase teams are already connecting agents to data — and where the pattern breaks
Supabase’s production-ready MCP server gives agents substantial capability for database management and debugging. Its remote-hosted service uses OAuth login and offers more than 20 tools covering SQL execution, migrations, logs, extensions, and project management. For operational agent access, the recommended pattern separates the server into a stateless HTTP service, uses Realtime for event-driven context, and deploys lightweight endpoints as Edge Functions. Row-level security supplies tenant isolation.
Supabase Select 2026 extended that pattern to a product’s end users. An MCP server runs as an Edge Function, users authenticate through the existing Auth flow, and each tool call executes as that user. RLS determines what the call can reach. This lets builders give customers a way to connect their own agents without having to create a separate identity model.
Even an authorized execute_sql call can calculate revenue in a way that differs from the finance team’s approved definition, and the Supabase MCP layer itself does not stop that from happening. Production deployments should pin the server version, use connection pooling to cap the number of connections, and send analytical calls to replicas. Those controls make access safer, but they do not turn database-management tools into a governed analytics backend.
Observability as the early-warning system that makes governed metrics trustworthy over time
An approved calculation remains dependent on the health of the Postgres instance supplying its data. Every paid Supabase project exposes a Prometheus-compatible Metrics API for database health and performance data. OpenTelemetry integration also allows logs, metrics, and traces to reach compatible observability tools. Keeping database and application signals together makes it possible to relate API latency to connection saturation or a query regression to a deployment. Without that context, a correct definition can hide problems in the path that supplies the data.
Useful alerts warn when connection counts are close to pool limits, the cache hit ratio is falling, API p95 latency is above one second, or disk space is critically low. Replication lag and lock contention also matter to the reliability of the metric layer. These signals help distinguish a calculation problem from an infrastructure problem before a returned number is treated as dependable.
Supabase’s September 2026 “Observability on Auto-Pilot” release adds query_logs for structured access across API, Auth, Storage, Edge Functions, and Postgres logs. Its agent prompts are scoped to health, security, performance, and capacity jobs.
What analytics backend gives Supabase teams API control without a required dashboard UI
For a Supabase team, the governed pattern keeps Postgres as the analytical home while separating consumption from production queries. Metrics are modeled and pre-calculated into governed Parquet datasets that DuckDB can query. A single MCP endpoint exposes those datasets to agents and AI workflows without giving them production database access. APIs provide another consumption path, so a dashboard is an optional client of the analytics layer. Usage analytics can reach an agent without first becoming a prebuilt dashboard.
Dreambase implements this pattern for Supabase teams through a specialized analytics MCP server. It translates tool calls into queries restricted to modeled datasets and handles authentication, schema mapping, and permission enforcement. Its governed layer attaches to an existing Supabase project with no ETL, no schema changes, and no separate data warehouse. That makes it an option for teams that want analytics access without a migration project or a data engineer just for that work.
The choice depends on the job. Supabase’s own MCP tooling fits project management, debugging, and user-scoped operational access, while Dreambase supplies pre-calculated analytics for human and agent consumers. Salesforce’s Headless Data 360 for MCP addresses semantic modeling and querying in its data environment, while ZoomInfo’s GTM.AI provides verified GTM context.
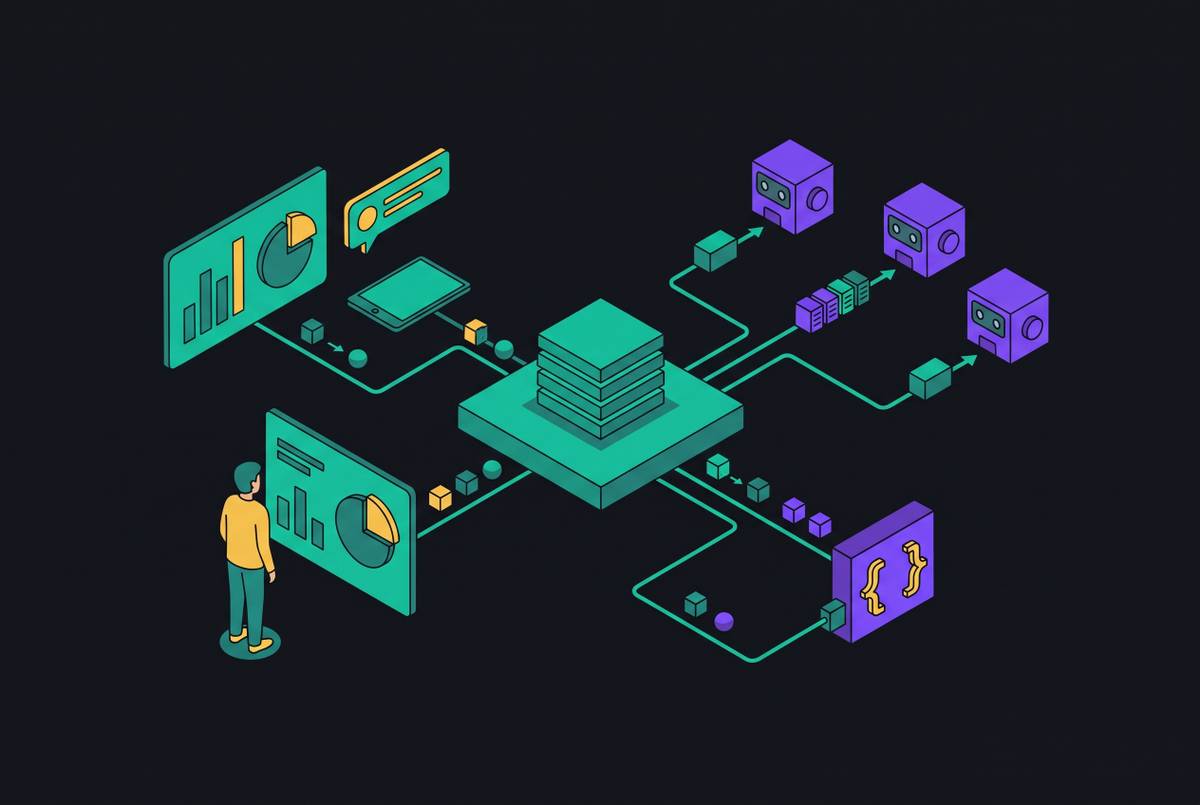
With Dreambase’s shared metric layer, a dashboard, an agent answering a Slack question, and a scheduled inbox report all use one approved calculation. The same holds when a product’s users connect their own agents through the Supabase pattern. Production credentials stay outside the agent, analytical queries run against optimized datasets, and definitions remain auditable. Scheduled delivery also moves the governed number into the places where decisions happen independently of when someone opens a dashboard.
How to evaluate whether your MCP analytics setup is actually governed
Begin with the metric definition test. There should be one identifiable place where a core KPI such as revenue is defined, and every dashboard, agent, and scheduled report should consume that definition. If establishing the answer requires reconciling several files, schemas, or tools, the layer is not governed. Then use the repeatability test to check whether two agents using the same parameters get the same approved answer. The relevant distinction is retrieval from a shared calculation versus a fresh interpretation of business logic.
The access audit test checks whether every tool call records what data it accessed and whose authorization it used. The layer needs that record to support an audit in a regulated or multi-tenant setting. The production isolation test asks whether the agent’s query path is physically separated from production writes. At a minimum, that boundary needs a read replica under RLS. A pre-modeled dataset in a separate query engine, such as DuckDB against Parquet, provides stronger separation.
Finally, the staleness test asks for the maximum age of data an agent can return and whether that delay fits the decision. Data that is hours old may suit weekly reporting but not real-time inventory or pricing decisions. Repeatability must be judged along with freshness, allowing for changes in live business data. Passing all five tests establishes a governed analytics layer. If it fails any of them, it remains a data access layer whose answers can start to disagree as more agents use it, however well the MCP server connects.