Metric Ownership Without a Frontend Dependency in API-First Data Stacks
Shared metric definitions let dashboards, agents, and apps consume the same authoritative number.

For API-first and agent-first teams, a headless analytics platform should own metric definitions, governance, and calculation in a shared data layer, without requiring an opinionated frontend. Full API control is useful only when every consumer can request the same authoritative metric. Metric ownership without a frontend dependency makes dashboards, AI agents, and Slack reports interchangeable consumers.
Why metric logic ends up in the wrong place
Two analysts answer the same revenue question and get different numbers. One uses the definition in a dashboard, while the other rebuilds the calculation from raw tables for an embedded app. Their queries make different choices about dates, filters, or exclusions. Both answers seem reasonable for the work each analyst is doing. The disagreement begins with an architectural default.
Traditional BI software bundles metric definition and presentation into one product, leaving business logic inside the tool that renders it. Where that tool offers no API for the definition, another consumer cannot reuse the logic. Visivo identifies this as the point at which a new consumer must reimplement the metric and create another potentially divergent copy. The first duplicate is cheap to write. Its longer-term cost grows as more consumers make their own choices and the organization has to reconcile them.
Three failure modes that compound when metric logic lives in the UI
Every new surface that recomputes a metric from raw tables is another place where the numbers can differ. One implementation filters out trials while another includes them, or one uses order date while another uses ship date. Visivo describes the resulting reconciliation work as a recurring tax on the analytics team. The difficulty is not merely finding a wrong query, because the competing implementations may encode different understandings of the business.
Definitions that exist only inside a BI tool tie the company's measurement logic to its choice of interface. To leave the tool, the company then has to rebuild that logic as well as replace the presentation layer. A decision about screens becomes a constraint on infrastructure.
The third failure is the inability to reuse existing work. An AI assistant, embedded widget, or reverse-ETL pipeline needs a revenue number but has nowhere shared to request it. Each new implementation then accelerates the first failure and deepens the second. In 2026, Slack digests, agents, embedded product analytics, reverse-ETL syncs, and automated alerts make this a routine architectural concern. Documentation and agreed conventions can help humans coordinate, but they do not enforce definitions under agent load because agents do not read the wiki.
What it means for a metric to live in a dedicated layer instead of a UI
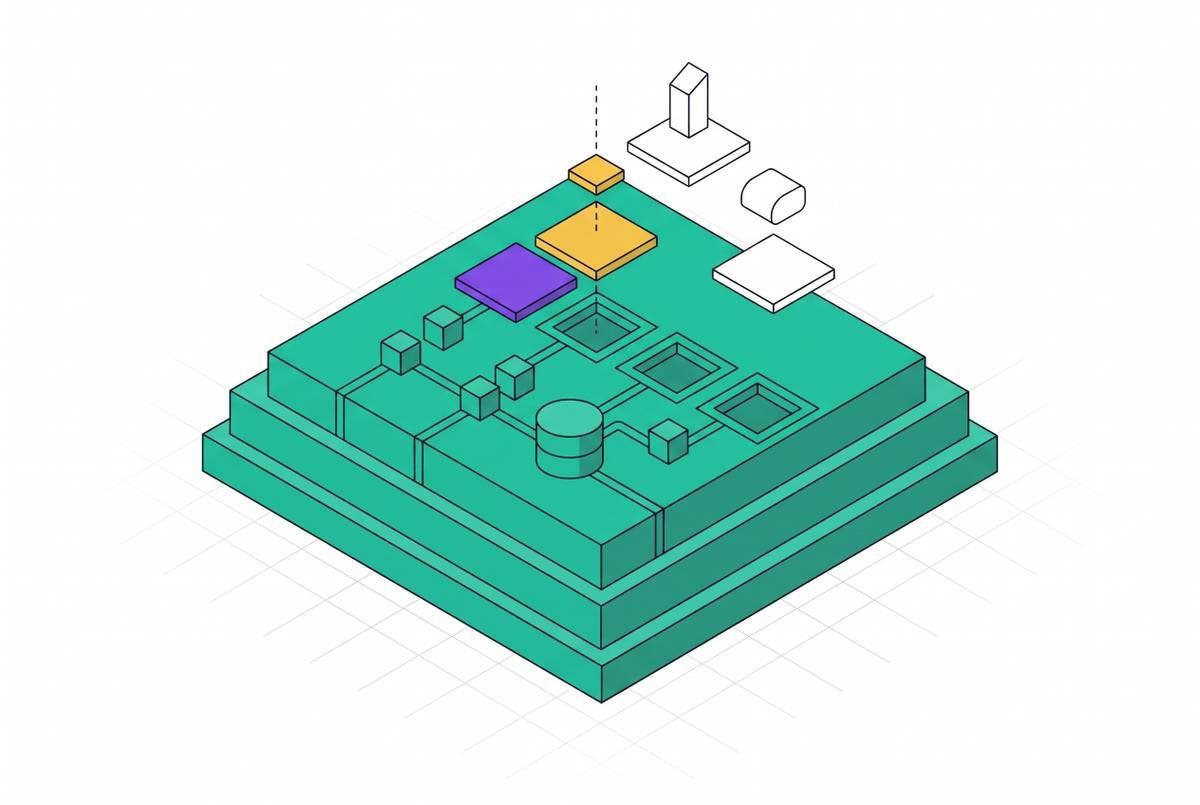
A dedicated metrics layer holds the definition, governance, and calculation of a metric outside any single presentation tool. Any authorized consumer can call it. Visivo describes this inversion as the defining difference between traditional and headless BI, with the dashboard becoming one consumer of a shared layer. The metric becomes infrastructure whose availability is independent of whether a particular frontend renders it.
Ownership requires more than a stored formula. The layer holds the calculation, the dimensions by which it can be sliced, the relationships between entities, the controls governing access to rows, and metadata describing ownership, freshness, and lifecycle state. These elements belong together because a calculation alone cannot explain how a requested breakdown relates to the data or who may receive it.
The analogy is a headless CMS, where content is stored and served through an API independently of its presentation. Here, the reusable content is the metric definition. The semantic layer describes what the team builds, while headless BI describes how consumers use it. That distinction keeps the architecture separate from any particular screen. The important dependency runs from the consumer to the governed metric.
Visivo illustrates the payoff with monthly_recurring_revenue, defined once and consumed by an executive dashboard, a customer-facing embedded widget, an AI assistant, a Slack bot, and a reverse-ETL sync to the CRM. Finance then changes the definition to exclude setup fees. Every surface updates in lockstep through the shared metric definition governing the five separate implementations.
What a governed metrics layer must actually enforce, not just serve
Serving a calculation through an API does not establish governance. A serving layer can return a result without settling who may receive it, how it was calculated, or whether the query was permissible. These are separate jobs with different evaluation criteria. A headless architecture removes the frontend dependency, but that alone does not make its query interface safe. The assessment must also check that permissions are enforced.
Malloy Publisher's own documentation makes the distinction concrete. Its server ships without authentication and binds all interfaces by default, allowing anyone who can reach the port to run queries through configured connections. Its README advises binding it to loopback or placing an authenticating gateway in front. Used as a governed serving layer, it requires controls beyond those of the unauthenticated server.
Licensing can also set a boundary between modeling and serving. The dbt Semantic Layer architecture documentation places its Service Layer and APIs in proprietary cloud offerings, while MetricFlow is Apache 2.0 licensed. Lightdash's documentation says cloud users have MCP, while self-hosted organizations need an Enterprise license and must turn it on. Neither an open-source modeling component nor a self-hosted deployment therefore establishes that the required agent interface is included.
The lesson for evaluation is to ask specific questions. Does the open-source version come with the agent API? When does the permission check run, at compile time or execution time? What happens to rate limits and cost under agent load? Those answers show whether the serving layer fits how it will be deployed and the requests it will get, beyond showing that an API exists.
Why AI agents specifically break when metric logic is not in a dedicated layer
A human may see that reports disagree and ask for the numbers to be checked, while an agent that guesses a metric definition may act on its answer. Direct table access supplies data without necessarily supplying business meaning. An agent can therefore write SQL that runs but uses the wrong definition.
The appropriate access pattern is a governed query interface. It accepts a metric name, filters, and dimensions, then returns results with provenance. An agent adding usage analytics needs an authoritative definition to request. Production database credentials should never be embedded in its configuration. Agent database queries should instead pass through a centralized gateway that enforces permissions and logs access.
This pattern also changes the requirements for oversight. Batch processing and periodic audits cannot keep up with fast decisions that agents make on their own. Observability must track data touchpoints, decision nodes, and API calls so that people can check who accessed the data and how it was then used. The governed layer gives agents semantic grounding, while the controls around it make it possible to hold them accountable for how they use it.
MCP, the Model Context Protocol, is a new standard that agents use to call tools and access resources. It is an interface. It does not clean, transform, or govern the data beneath it, so identity, permissions, query performance, lineage, cost controls, and auditability remain necessary. The productive pairing is a governed metrics layer as the resource and MCP as the interface agents use to reach it. Heavily regulated environments also require additional controls for data residency, audit trails, and access frameworks that MCP's current architecture does not natively address.
What metric ownership looks like for Supabase teams that need raw API access
For teams building on Supabase or other Postgres-based infrastructure, metric ownership does not require moving operational data into a separate warehouse. It requires modeling the data already present and exposing the resulting metrics safely. The frontend can remain entirely optional. Teams need raw API access to get the metrics, while the governed layer sets what that access means and allows. Separating those concerns avoids treating direct access to production tables as equivalent to an analytics backend.
Supabase provides dedicated Postgres compute for each project, with tiers extending to 64 CPU cores and 256 GB of RAM. It also provides Supavisor connection pooling, read replicas, and multi-region read scaling. These capabilities provide infrastructure for substantial analytical workloads. They do not settle capacity on their own. Scale still depends on query design, indexing, connection management, and workload characteristics.
Supabase's own discussion thread describes Joe Sciarrino, co-creator of Hydra, joining to build Supabase Warehouse, an open data warehouse architecture for developers. Hydra co-developed pg_duckdb to accelerate analytical queries on Postgres. That development signals first-party investment in Postgres as an analytical home. It does not remove the need for workload isolation. To isolate analytical workloads from the live transactional database, analytical serving should target read replicas, materialized views, or pre-calculated datasets queryable through DuckDB.
A minimum viable governed layer can pre-model business metrics into governed Parquet datasets queryable through DuckDB. One consistent interface, such as an MCP server, can let agents query those datasets without giving them the production connection string. This is a concrete route to analytics without a dashboard dependency. Its reliability still depends on the health of the queries producing the metrics. Ownership therefore includes visibility into execution alongside agreement about definitions.
Supabase exposes a Metrics API endpoint compatible with a metrics monitoring system for every project, providing Postgres performance and health series. The observability inputs are already available. pg_stat_statements records query mean time, total time, and call count, helping identify analytical calculations that should be pre-calculated. Some managed Postgres platforms preload it, while others, including RDS, Aurora, and Cloud SQL, require explicit activation. Relevant signals include active connections above 80% of the maximum, cache hit ratio below the chosen threshold for hot data, p95 query latency above a stated SLO, connection pool saturation, and API throttling.
How to assign real ownership to a metric, not just a definition
A shared layer becomes governed only when a person is accountable for each metric. That responsibility covers correctness, freshness, and the decision to change the definition. A team name is not enough. Shared accountability can diffuse responsibility and stall decisions, leaving the layer to reproduce the original drift problem at a higher level. The practical requirement is one named owner per metric.
That owner writes the canonical definition and decides when it changes. The owner also confirms that the calculation is correct against the underlying data and communicates changes to consumers before they propagate. Centralizing execution makes these duties more important because a shared change reaches every dependent surface.
The scope of the layer should follow the maturity of its definitions. Early-stage priorities are learning, activation, and retention signals, while CAC efficiency, revenue expansion, and net revenue retention belong in the layer once core metrics are stable. A smaller governed layer can be more trustworthy. An expansive catalog with contested definitions adds infrastructure without resolving the disagreement that infrastructure is meant to contain. Clear ownership is the practical constraint on expansion.
Once ownership is established, metrics can be pushed to where people work, including inboxes, Slack, and phones. A daily digest, weekly email, or automated alert calls the layer for the calculation. Delivery becomes independent of the business logic. The presentation layer is optional. The governed metrics layer is not. A team without a dashboard can still have trustworthy numbers, but a team without a governed layer cannot establish a shared authority merely by building more dashboards.